Get Office 365 Groups Inventory Using PowerBi and Graph API
The Office 365 Graph API is an excellent API and continuously getting updated with new endpoint/urls and by using this API we can achieve more including the creation process of Office 365 Groups. If you haven’t used it yet, Graph API Explorer is a great place to start with.
For this blog, I had the following requirements to work with:
- Get a list of all Groups from my tenant
- Get list of Groups created today
- and Groups Classified as High Business Risk
Initially, I thought of using MS Flow, but keeping the data current was a challenging. Although we can use delta feature/function with the Graph API and John Liu recently wrote an excellent blog on Know your group shows delta usage in action.
Let’s use PowerBi and Graph API to achieve something similar. I am using PowerBI desktop but Online version could easily be used for this.
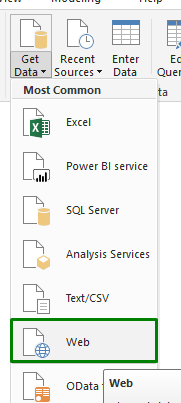
STEP 1 – Get Groups Data Using GRAPH API URL
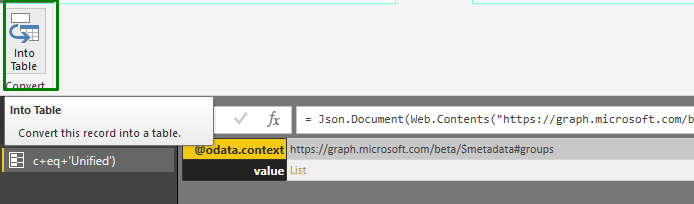
Click ‘Get Data’ and selection ‘Web’ and enter the following URL:
https://graph.microsoft.com/beta/groups?$top=500&$filter=groupTypes/any(c:c+eq+'Unified')
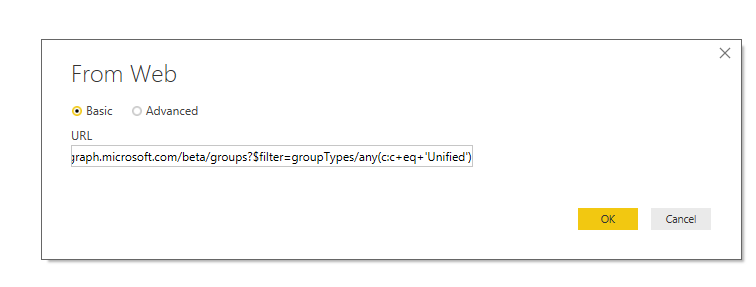
Note, that the URL has filter which is only giving you ‘Unified’ group i.e. Office 365 Groups and also I am adding top=500 because by default graph will return only 100 records. You will be prompted to authenticate and now have required data! Extremely simple, but in JSON format.
STEP 2 – Let’s now prepare data received for a PowerBi report:
We will need to covert data from JSON to table format.
Click the List object received:
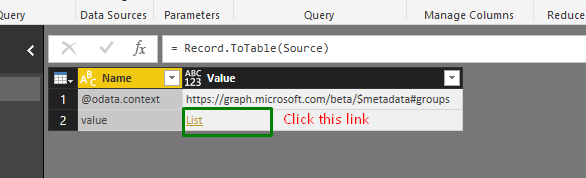
This step will covert JSON object into a table.
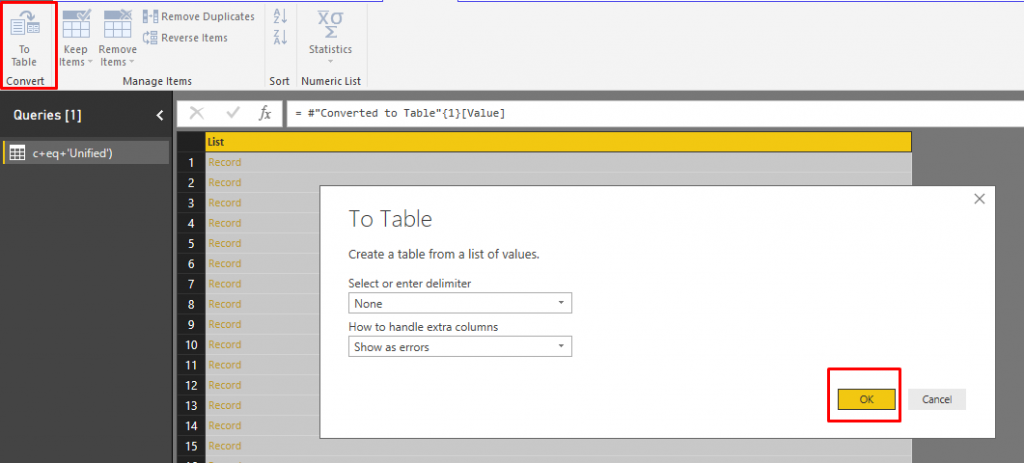
Here we have our data in a more readable format. Let’s rename the Table name. This is also easiest way to get all the group ids.
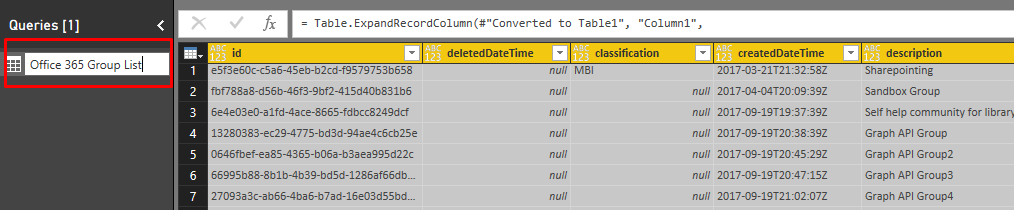
Now if we sort the data by ‘createdDateTime’ (I have renamed this to Created Date Time) we get our Groups by data, but for this report purposes, let’s create a column so we get a count of the groups created today.
First, we need to create a New Measure to get Today’s date. We can create similar Measure column for ‘Last Week’ ‘Last Month’ etc.
Today = DATE(year(NOW()),MONTH(NOW()), DAY(NOW()))
Now we can pass this to New Column which will give us ‘True’ or ‘False’ value if the group was created today. Note, I had to format the date to get only the date part.
CreatedToday = IF(format('Office 365 Group List'[Created Date Time],"dd/mm/yyyy")=FORMAT([Today],"dd/mm/yyyy"),"TRUE","FALSE")
And with the magi of creating visual, we have our final report with a list of all groups. The number of groups created today.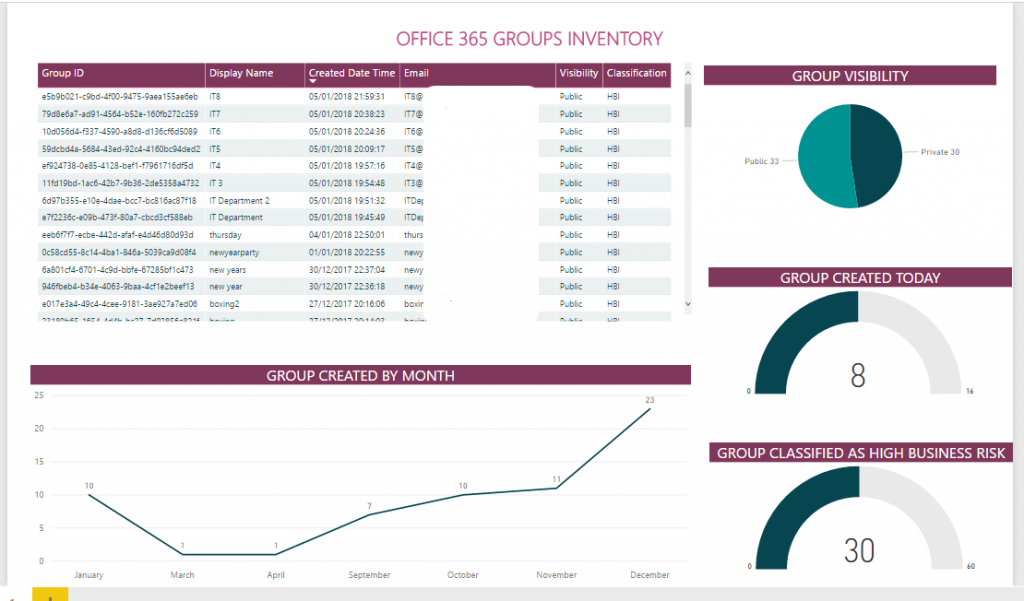
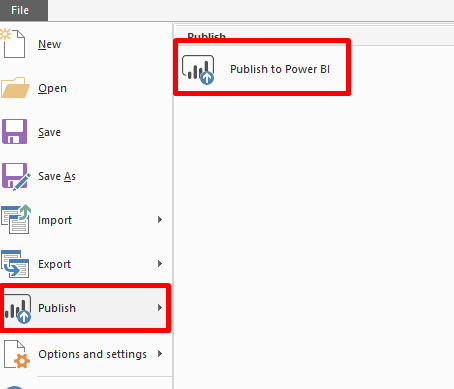
STEP 3 – Publish the report and configure refresh schedule
Let’s now publish this to PowerBi workspace, this is where we will set the refresh schedule so our report always gives the more recent data.
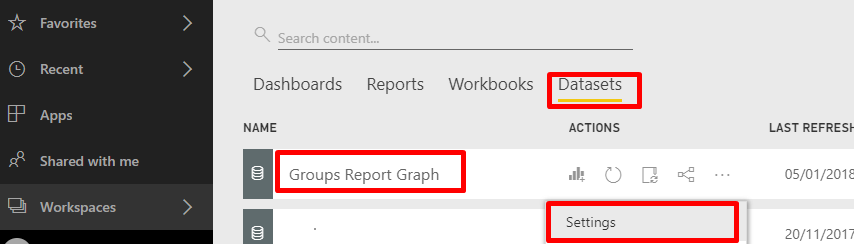
Click ‘Datasets‘ under relevant Workspace and then click the ‘Settings‘ for our datasets.
I have selected Daily and provided a specific time. There is an option for ‘Weekly’.
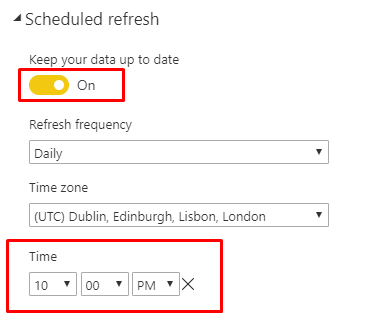
This report refresh everyday providing us with some insight about Office 365 Groups created.